1. Discuss the eight principles of the ISO 9000 standard
The ISO 9000 is a family of standards and guidelines related to the quality management system (QMS). It sets the requirements for the assurance of quality and for management’s involvement. The thrust of ISO 9000 is for organizations to implement a QMS conforming to the standard’s requirements and, through the consistent, rigorous employment of the QMS, to
Improve customer satisfaction by fulfilling customer requirements
Achieve continual improvement of organizational performance and competitiveness
Continually improve its processes, products, and services
Comply with regulatory requirements
The ISO 9000 eight principles from total quality management are as follows
1. Customer Focus -Understand the customer’s needs, meet the customer’s requirements, and strive to exceed the customer’s expectations.
2. Leadership - Establish unity of purpose and organizational direction and provide an environment that promotes employee involvement and achievement of objectives.
3. Involvement of People - Take advantage of fully involved employees, using all their abilities for the benefit of the organization.
4. Process Approach -Recognize that things accomplished are the results of processes and that processes along with related activities and resources must be managed.
5. System Approach to Management -The multiple interrelated processes that contribute to the organization’s effectiveness are a system and should be managed as a system.
6. Continual Improvement -Continual improvement should be a permanent objective applied to the organization and to its people, processes, systems, and products.
7. Factual Approach to Decision Making - Decisions must be based on the analysis of accurate, relevant, and reliable data and information.
8. Mutually Beneficial Supplier Relationships -Both the organization and the supplier benefiting from one another’s resources and knowledge results in value for all
2. Discuss Pareto Charts
A Pareto chart, also called a Pareto distribution diagram, is a vertical bar graph in which values are plotted in decreasing order of relative frequency from left to right. Pareto charts are extremely useful for analyzing what problems need attention first because the taller bars on the chart, which represent frequency, clearly illustrate which variables have the greatest cumulative effect on a given system.
The Pareto chart provides a graphic depiction of the Pareto principle, a theory maintaining that 80% of the output in a given situation or system is produced by 20% of the input. The Pareto chart is one of the seven basic tools of quality control. The independent variables on the chart are shown on the horizontal axis and the dependent variables are portrayed as the heights of bars.
A point-to-point graph, which shows the cumulative relative frequency, may be superimposed on the bar graph. Because the values of the statistical variables are placed in order of relative frequency, the graph clearly reveals which factors have the greatest impact and where attention is likely to yield the greatest benefit.
Usage and Benefits of Pareto Charts
Pareto Charts are very useful tools to focus attention and apply resources to the "big" problem areas in business.
Often people know how to make improvements to a process but they are not aware of the point from where they should start working. This is where the Pareto charts can help. There can be different types of errors and problems in a process like customer dissatisfaction, complaints, measurement irregularities, employee attrition and unnecessary delays and these errors round up to create major discrepancies in the process outputs.
In conclusion, using Pareto Charts help you identify:
3. Discuss fish bone diagram
A cause and effect diagram, often called a “fish bone” diagram, can help in brainstorming to identify possible causes of a problem and in sorting ideas into useful categories. A fish bone diagram is a visual way to look at cause and effect.
It is a more structured approach than some other tools available for brainstorming causes of a problem. The problem or effect is displayed at the head or mouth of the fish. Possible contributing causes are listed on the smaller “bones” under various cause categories.
A fish bone diagram can be helpful in identifying possible causes for a problem that might not otherwise be considered by directing the team to look at the categories and think of alternative causes.
Use of the Fish bone Tool for Root Cause Analysis
The ISO 9000 is a family of standards and guidelines related to the quality management system (QMS). It sets the requirements for the assurance of quality and for management’s involvement. The thrust of ISO 9000 is for organizations to implement a QMS conforming to the standard’s requirements and, through the consistent, rigorous employment of the QMS, to
Improve customer satisfaction by fulfilling customer requirements
Achieve continual improvement of organizational performance and competitiveness
Continually improve its processes, products, and services
Comply with regulatory requirements
The ISO 9000 eight principles from total quality management are as follows
1. Customer Focus -Understand the customer’s needs, meet the customer’s requirements, and strive to exceed the customer’s expectations.
2. Leadership - Establish unity of purpose and organizational direction and provide an environment that promotes employee involvement and achievement of objectives.
3. Involvement of People - Take advantage of fully involved employees, using all their abilities for the benefit of the organization.
4. Process Approach -Recognize that things accomplished are the results of processes and that processes along with related activities and resources must be managed.
5. System Approach to Management -The multiple interrelated processes that contribute to the organization’s effectiveness are a system and should be managed as a system.
6. Continual Improvement -Continual improvement should be a permanent objective applied to the organization and to its people, processes, systems, and products.
7. Factual Approach to Decision Making - Decisions must be based on the analysis of accurate, relevant, and reliable data and information.
8. Mutually Beneficial Supplier Relationships -Both the organization and the supplier benefiting from one another’s resources and knowledge results in value for all
2. Discuss Pareto Charts
A Pareto chart, also called a Pareto distribution diagram, is a vertical bar graph in which values are plotted in decreasing order of relative frequency from left to right. Pareto charts are extremely useful for analyzing what problems need attention first because the taller bars on the chart, which represent frequency, clearly illustrate which variables have the greatest cumulative effect on a given system.
The Pareto chart provides a graphic depiction of the Pareto principle, a theory maintaining that 80% of the output in a given situation or system is produced by 20% of the input. The Pareto chart is one of the seven basic tools of quality control. The independent variables on the chart are shown on the horizontal axis and the dependent variables are portrayed as the heights of bars.
A point-to-point graph, which shows the cumulative relative frequency, may be superimposed on the bar graph. Because the values of the statistical variables are placed in order of relative frequency, the graph clearly reveals which factors have the greatest impact and where attention is likely to yield the greatest benefit.
Usage and Benefits of Pareto Charts
Pareto Charts are very useful tools to focus attention and apply resources to the "big" problem areas in business.
Often people know how to make improvements to a process but they are not aware of the point from where they should start working. This is where the Pareto charts can help. There can be different types of errors and problems in a process like customer dissatisfaction, complaints, measurement irregularities, employee attrition and unnecessary delays and these errors round up to create major discrepancies in the process outputs.
In conclusion, using Pareto Charts help you identify:
- What are the largest issues facing your team or business
- What 20% of sources are causing 80% of the problems (80/20 Rule)
- Where should you focus your efforts to achieve the greatest improvements
3. Discuss fish bone diagram
A cause and effect diagram, often called a “fish bone” diagram, can help in brainstorming to identify possible causes of a problem and in sorting ideas into useful categories. A fish bone diagram is a visual way to look at cause and effect.
It is a more structured approach than some other tools available for brainstorming causes of a problem. The problem or effect is displayed at the head or mouth of the fish. Possible contributing causes are listed on the smaller “bones” under various cause categories.
A fish bone diagram can be helpful in identifying possible causes for a problem that might not otherwise be considered by directing the team to look at the categories and think of alternative causes.
Use of the Fish bone Tool for Root Cause Analysis
- Use the fish bone diagram tool to keep the team focused on the causes of the problem, rather than the symptoms
- Consider drawing your fish on a flip chart or large dry erase board.
- Make sure to leave enough space between the major categories on the diagram so that you can add minor detailed causes later.
- When you are brainstorming causes, consider having team members write each cause on sticky notes, going around the group asking each person for one cause. Continue going through the rounds, getting more causes, until all ideas are exhausted.
- Encourage each person to participate in the brainstorming activity and to voice their own opinions.
- The “five-whys” technique is often used in conjunction with the fish bone diagram – keep asking why until you get to the root cause.
- To help identify the root causes from all the ideas generated, consider a multi-voting technique such as having each team member identify the top three root causes.-

4. Discuss histograms
Histograms are used to chart frequency of occurrence. Histograms are very useful tools for making quality improvements. Since the histogram is such a useful tool, it can have many uses.
There are two types of data that are related with processes which are attributes and variables data. The output product of a certain process either has or does not have an attribute. Data that shows results of when something is measured is known as variable data. When a measurement is taken over along period of time, potential traps can occur when using a histogram
Histogram is a TQM tool basically used by the management to improve organization quality and production, especially quality management chart business. Analysts examine the TQM effect on profitability and productivity on an organization and develop the corresponding management strategy. It is a widespread organization methodology that is applied horizontally in all directions. It involves all employees and their departments, suppliers, customers, and clients improvement, quality function deployment, statistical quality control, quality in daily work, and total quality control.
5. Discuss control charts for variables
In all production processes, we need to monitor the extent to which our products meet specifications. In the most general terms, there are two "enemies" of product quality:
The control chart is one of the seven basic tools of quality control. Typically control charts are used for time-series data, though they can be used for data that have logical comparability.
If analysis of the control chart indicates that the process is currently under control, then no corrections or changes to process control parameters are needed or desired. In addition, data from the process can be used to predict the future performance of the process.
If the chart indicates that the monitored process is not in control, analysis of the chart can help determine the sources of variation, as this will result in degraded process performance. A process that is stable but operating outside of desired (specification) limits needs to be improved through a deliberate effort to understand the causes of current performance and fundamentally improve the process.
The general approach to on-line quality control is straightforward: We simply extract samples of a certain size from the ongoing production process. We then produce line charts of the variability in those samples and consider their closeness to target specifications.
There are two variables, special causes and common causes that are used in developing the lower control and upper control lines. The common causes tread right around the center line, which is the average. Anything from special causes would have the line deviate from center and tread closer to the upper or lower control.
If a trend emerges in those lines, or if samples fall outside pre-specified limits, we declare the process to be out of control and take action to find the cause of the problem.
6. Discuss flowcharts and give a simple example
Flowchart is a graphic representation of a process. A necessary step in improving a process is to sketch a flowchart.A flowchart is a type of diagram that represents an algorithm, workflow or process, showing the steps as boxes of various kinds, and their order by connecting them with arrows. This diagrammatic representation illustrates a solution model to a given problem. Flowcharts are used in analyzing, designing, documenting or managing a process or program in various fields
Types of Flow-Chart
High-Level Flowchart
A high-level flowchart shows the major steps in a process. It illustrates a "birds-eye view" of a process; such a flowchart offers a basic picture of the process and identifies the changes taking place within the process
Detailed Flowchart
The detailed flowchart provides a detailed picture of a process by mapping all of the steps and activities that occur in the process. This type of flowchart indicates the steps or activities of a process and includes such things as decision points, waiting periods, tasks that frequently must be redone (rework), and feedback loops.
Deployment or Matrix Flowchart
A deployment flowchart maps out the process in terms of who is doing the steps. It is in the form of a matrix, showing the various participants and the flow of steps among these participants. It is chiefly useful in identifying who is providing inputs or services to whom, as well as areas where different people may be needlessly doing the same task
Example of Ordering a Burger at any Fast food chain.
Histograms are used to chart frequency of occurrence. Histograms are very useful tools for making quality improvements. Since the histogram is such a useful tool, it can have many uses.
- To display large amounts of data values in a relatively simple chart form
- To tell relative frequency of occurrence
- To easily see the distribution of the data
- To see if there is variation in the data
- To make future predictions based on the data
There are two types of data that are related with processes which are attributes and variables data. The output product of a certain process either has or does not have an attribute. Data that shows results of when something is measured is known as variable data. When a measurement is taken over along period of time, potential traps can occur when using a histogram
Histogram is a TQM tool basically used by the management to improve organization quality and production, especially quality management chart business. Analysts examine the TQM effect on profitability and productivity on an organization and develop the corresponding management strategy. It is a widespread organization methodology that is applied horizontally in all directions. It involves all employees and their departments, suppliers, customers, and clients improvement, quality function deployment, statistical quality control, quality in daily work, and total quality control.
5. Discuss control charts for variables
In all production processes, we need to monitor the extent to which our products meet specifications. In the most general terms, there are two "enemies" of product quality:
- Deviations from target specifications
- Excessive variability around target specifications
The control chart is one of the seven basic tools of quality control. Typically control charts are used for time-series data, though they can be used for data that have logical comparability.
If analysis of the control chart indicates that the process is currently under control, then no corrections or changes to process control parameters are needed or desired. In addition, data from the process can be used to predict the future performance of the process.
If the chart indicates that the monitored process is not in control, analysis of the chart can help determine the sources of variation, as this will result in degraded process performance. A process that is stable but operating outside of desired (specification) limits needs to be improved through a deliberate effort to understand the causes of current performance and fundamentally improve the process.
The general approach to on-line quality control is straightforward: We simply extract samples of a certain size from the ongoing production process. We then produce line charts of the variability in those samples and consider their closeness to target specifications.
There are two variables, special causes and common causes that are used in developing the lower control and upper control lines. The common causes tread right around the center line, which is the average. Anything from special causes would have the line deviate from center and tread closer to the upper or lower control.
If a trend emerges in those lines, or if samples fall outside pre-specified limits, we declare the process to be out of control and take action to find the cause of the problem.
6. Discuss flowcharts and give a simple example
Flowchart is a graphic representation of a process. A necessary step in improving a process is to sketch a flowchart.A flowchart is a type of diagram that represents an algorithm, workflow or process, showing the steps as boxes of various kinds, and their order by connecting them with arrows. This diagrammatic representation illustrates a solution model to a given problem. Flowcharts are used in analyzing, designing, documenting or managing a process or program in various fields
Types of Flow-Chart
High-Level Flowchart
A high-level flowchart shows the major steps in a process. It illustrates a "birds-eye view" of a process; such a flowchart offers a basic picture of the process and identifies the changes taking place within the process
Detailed Flowchart
The detailed flowchart provides a detailed picture of a process by mapping all of the steps and activities that occur in the process. This type of flowchart indicates the steps or activities of a process and includes such things as decision points, waiting periods, tasks that frequently must be redone (rework), and feedback loops.
Deployment or Matrix Flowchart
A deployment flowchart maps out the process in terms of who is doing the steps. It is in the form of a matrix, showing the various participants and the flow of steps among these participants. It is chiefly useful in identifying who is providing inputs or services to whom, as well as areas where different people may be needlessly doing the same task
Example of Ordering a Burger at any Fast food chain.

7. Explain what is an FMEA
Failure Mode and Effects Analysis (FMEA) is methodology for analyzing potential reliability problems early in the development cycle where it is easier to take actions to overcome these issues, thereby enhancing reliability through design.
FMEA is used to identify potential failure modes, determine their effect on the operation of the product, and identify actions to mitigate the failures. A crucial step is anticipating what might go wrong with a product. While anticipating every failure mode is not possible, the development team should formulate as extensive a list of potential failure modes as possible.
The early and consistent use of FMEAs in the design process allows the company to design out failures and produce reliable, safe, and customer pleasing products. FMEAs also capture historical information for use in future product improvement.
Types of FMEA's
Benefits of FMEA
8. Provide an overview of the Toyota practical problem solving process
Toyota’s “Practical Problem-Solving Process” is a methodology composed by eight different steps that aim at achieving a total quality approach by implementing continuous improvement
The 8 steps of the Toyota Business Process are:
1. Clarify the problem
Clarify the problem includes alignment to the Ultimate Goal or Purpose and to identify the Ideal situation, current situation and the gap
2. Breakdown the problem
Breakdown the problem requires breakdown into manageable pieces using the 4W’s and finding the Prioritized Problem, Process, and Point of Cause.
3. Set a target
Set a Target is to the Point of Cause and Determine “How much” and “By when”.
4. Analyze the root cause
Analyze Root Cause is to brainstorm multiple Potential Causes by asking WHY and to determine Root Cause by going to see the process.
5. Develop countermeasures
Develop Countermeasures is to brainstorm countermeasures, narrow using criteria, develop a detailed action plan, and gain consensus.
6. See countermeasure
Through means to share status of plan by reporting, informing and consulting and build consensus, never give up, think and act persistently
7. Evaluate both results and process
Determine if the target was achieved and evaluate 3 viewpoints, and look at process and results
8. Standardize successful processes
Standardize Successful practices, share results and start the next round of kaizen
Many of these steps have sub steps which address further questions that helps isolate and re-mediate the issues.
9. Explain a total quality decision making process
Decision making is the process of selecting one course of action from among two or more alternatives. Decision making is a critical task in a total quality setting. It plays the same role in an organization that fuel plays in an automobile engine: They keep it running.
The discipline of decision analysis provides the process and tools necessary for making quality decisions. The decision-making process is a logically sequenced series of activities through which decisions are made.
Failure Mode and Effects Analysis (FMEA) is methodology for analyzing potential reliability problems early in the development cycle where it is easier to take actions to overcome these issues, thereby enhancing reliability through design.
FMEA is used to identify potential failure modes, determine their effect on the operation of the product, and identify actions to mitigate the failures. A crucial step is anticipating what might go wrong with a product. While anticipating every failure mode is not possible, the development team should formulate as extensive a list of potential failure modes as possible.
The early and consistent use of FMEAs in the design process allows the company to design out failures and produce reliable, safe, and customer pleasing products. FMEAs also capture historical information for use in future product improvement.
Types of FMEA's
- System - focuses on global system functions
- Design - focuses on components and subsystems
- Process - focuses on manufacturing and assembly processes
- Service - focuses on service functions
- Software - focuses on software functions
Benefits of FMEA
- Improve product/process reliability and quality
- Increase customer satisfaction
- Early identification and elimination of potential product/process failure modes
- Prioritize product/process deficiencies
- Capture engineering/organization knowledge
- Emphasizes problem prevention
- Provide focus for improved testing and development
- Minimizes late changes and associated cost
8. Provide an overview of the Toyota practical problem solving process
Toyota’s “Practical Problem-Solving Process” is a methodology composed by eight different steps that aim at achieving a total quality approach by implementing continuous improvement
The 8 steps of the Toyota Business Process are:
1. Clarify the problem
Clarify the problem includes alignment to the Ultimate Goal or Purpose and to identify the Ideal situation, current situation and the gap
2. Breakdown the problem
Breakdown the problem requires breakdown into manageable pieces using the 4W’s and finding the Prioritized Problem, Process, and Point of Cause.
3. Set a target
Set a Target is to the Point of Cause and Determine “How much” and “By when”.
4. Analyze the root cause
Analyze Root Cause is to brainstorm multiple Potential Causes by asking WHY and to determine Root Cause by going to see the process.
5. Develop countermeasures
Develop Countermeasures is to brainstorm countermeasures, narrow using criteria, develop a detailed action plan, and gain consensus.
6. See countermeasure
Through means to share status of plan by reporting, informing and consulting and build consensus, never give up, think and act persistently
7. Evaluate both results and process
Determine if the target was achieved and evaluate 3 viewpoints, and look at process and results
8. Standardize successful processes
Standardize Successful practices, share results and start the next round of kaizen
Many of these steps have sub steps which address further questions that helps isolate and re-mediate the issues.
9. Explain a total quality decision making process
Decision making is the process of selecting one course of action from among two or more alternatives. Decision making is a critical task in a total quality setting. It plays the same role in an organization that fuel plays in an automobile engine: They keep it running.
The discipline of decision analysis provides the process and tools necessary for making quality decisions. The decision-making process is a logically sequenced series of activities through which decisions are made.

10. Explain why quality tools are important
Total Quality Management (TQM) is a systematic approach to quality improvement that marries product and service specifications to customer performance. TQM then aims to produce these specifications with zero defects. This creates a virtuous cycle of continuous improvement that boosts production, customer satisfaction and profits. TQM improves profitability by focusing on quality improvement and addressing associated challenges within an organization. TQM can be used to:
Total Quality Management (TQM) is a systematic approach to quality improvement that marries product and service specifications to customer performance. TQM then aims to produce these specifications with zero defects. This creates a virtuous cycle of continuous improvement that boosts production, customer satisfaction and profits. TQM improves profitability by focusing on quality improvement and addressing associated challenges within an organization. TQM can be used to:
- Increase productivity
- Lower scrap and rework costs
- Improve product reliability
- Decrease time-to-market cycles
- Decrease customer service problems
- Increase competitive advantage
SOCIAL NETWORKING ASSIGNMENT:
Detail Discussion is available on,
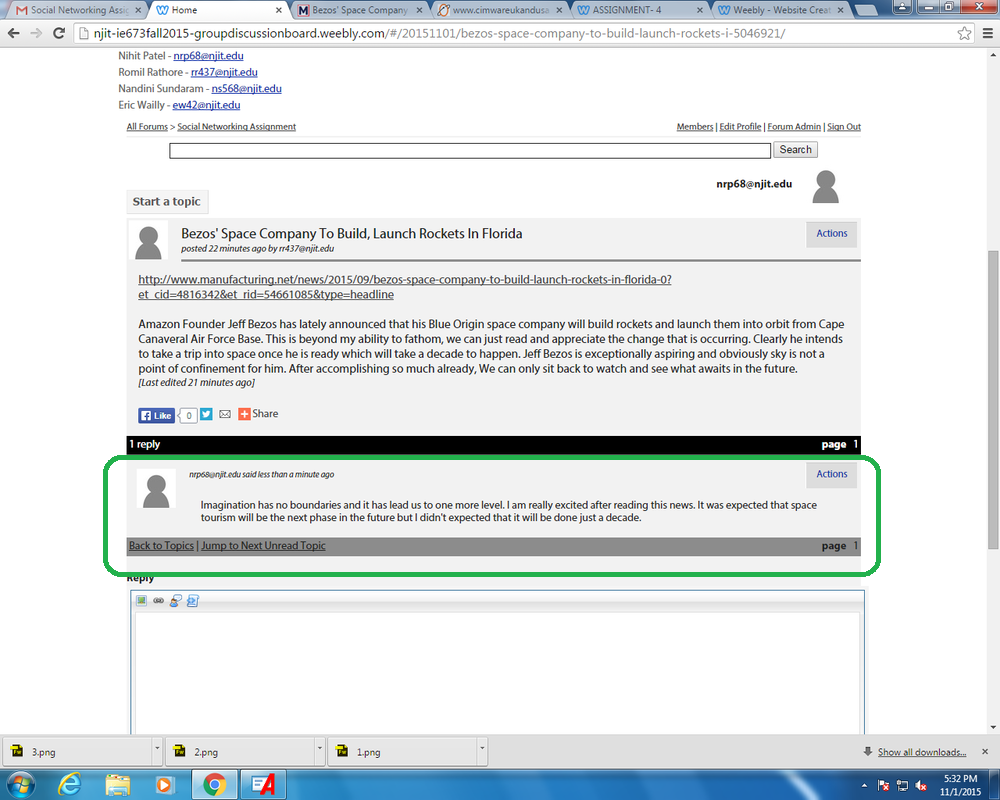
http://njit-ie673fall2015-groupdiscussionboard.weebly.com/#/20151101/bezos-space-company-to-build-launch-rockets-i-5046921/
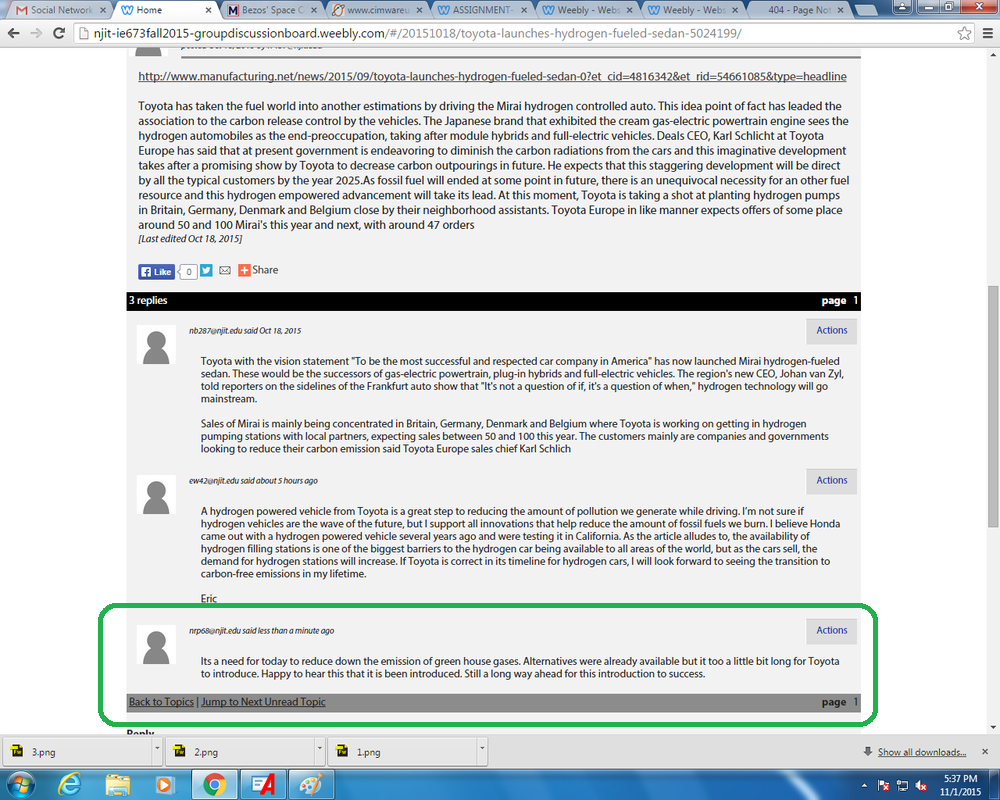
http://njit-ie673fall2015-groupdiscussionboard.weebly.com/#/20151018/toyota-launches-hydrogen-fueled-sedan-5024199/
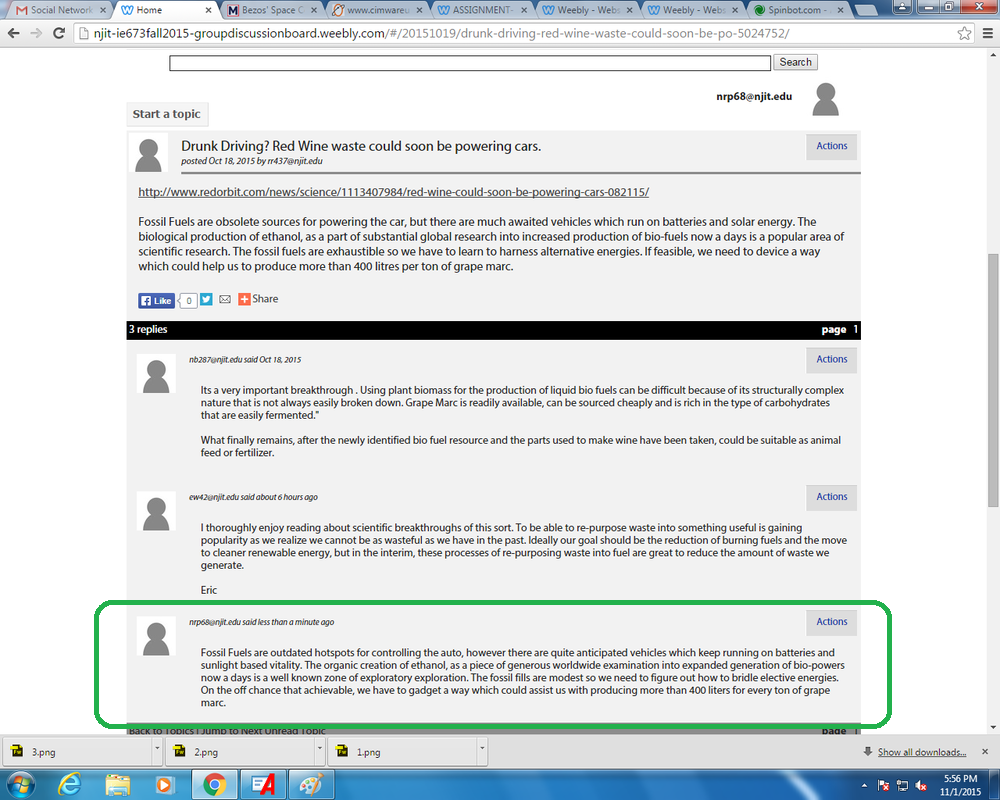
http://njit-ie673fall2015-groupdiscussionboard.weebly.com/#/20151019/drunk-driving-red-wine-waste-could-soon-be-po-5024752/
Detail Discussion is available on,
http://njit-ie673fall2015-groupdiscussionboard.weebly.com/#/20151101/bezos-space-company-to-build-launch-rockets-i-5046921/
http://njit-ie673fall2015-groupdiscussionboard.weebly.com/#/20151018/toyota-launches-hydrogen-fueled-sedan-5024199/
http://njit-ie673fall2015-groupdiscussionboard.weebly.com/#/20151019/drunk-driving-red-wine-waste-could-soon-be-po-5024752/